Guest Blog: Data in the time of Coronavirus, Pt. 2
 With ongoing the 2020 COVID-19 pandemic providing us with unprecedented insight into the progression of a disease outbreak, and unprecedented time in the lock down to turn us all into armchair epidemiologists. This includes near real-time sharing and analysis of genomics data through platforms like nextstrain, and of ways to view the infection, mortality and testing statistics via a growing number of online dashboards. Trying to digest and sift through these COVID-19 data streams, and following previous blogs on the Ebola and Zika epidemics, in early February we presented a data oriented guest post from Michael Dean who pooled together these various public sources to present a non-specialist view of the Coronavirus crisis. Two months on he provides a short update, and we have the foresight to look back if some of his predictions on how the crisis would unfold in China have come true. Michael is a researcher in the areas of human genetics and cancer. He has worked on the understanding of the role of host genetics in the response to HIV as well as cervical cancer and HPV.
Just over two months after the last blog post was written, on 7th April, China reported a day with no new deaths from COVID-19. However, the daily trend in cases and deaths around the world, shows that there are 4800-7100 new deaths per day reported worldwide in each of the last 7 days.
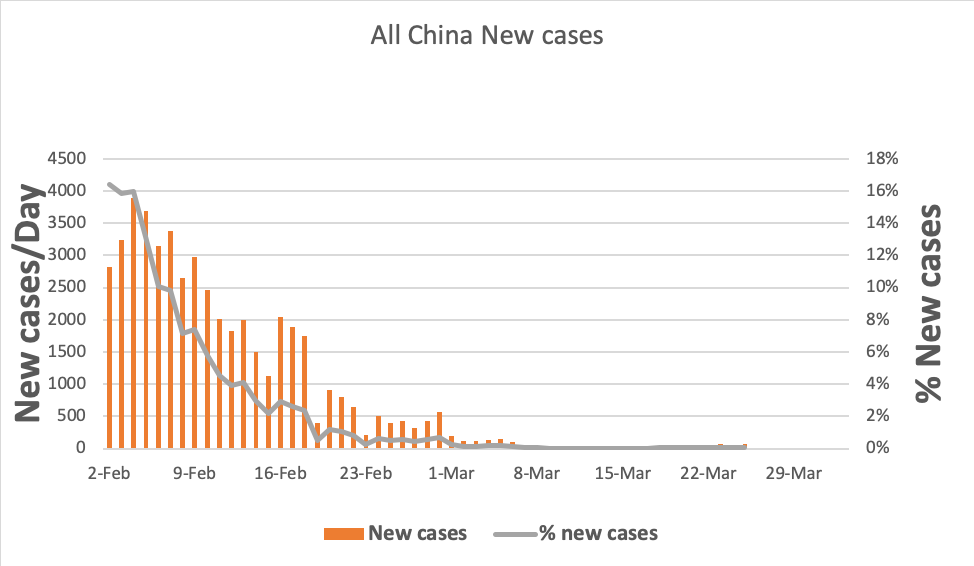
Following the timeline of the pandemic in China and South Korea is instructive for understanding the COVID-19 data in other countries. Plotting the daily increase in new cases, and the percentage of total cases that represents, shows that the peak of new cases occurred in China on 4th February and declined at a steady rate for the next month. A new case definition was introduced in 16th February to include cases with positive clinical signs.
On 15th February an extrapolation of that declining rate (a negative slope of ~15%/day) projected that China would drop to 100 new cases per day on 7th March and 10/day by 21st March. Despite the new case definition and jump in cases, China did drop to 99 new cases on 6th March and on 13th March reached 11 cases/day. However, after that, new cases rebounded somewhat and have hovered at an average of 70-80 new cases/day.
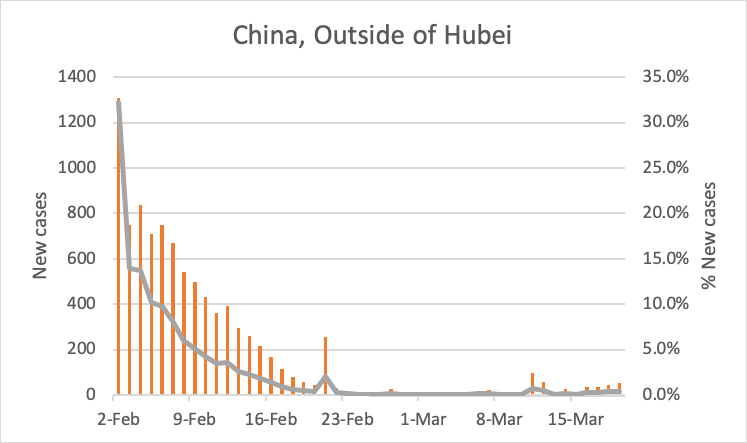
Subtracting the data from Hubei Province from the totals gives a picture of what happened in the rest of China. A very similar rate of decline can be observed, hitting a plateau with an average of about 20 new cases per day on 22nd February.
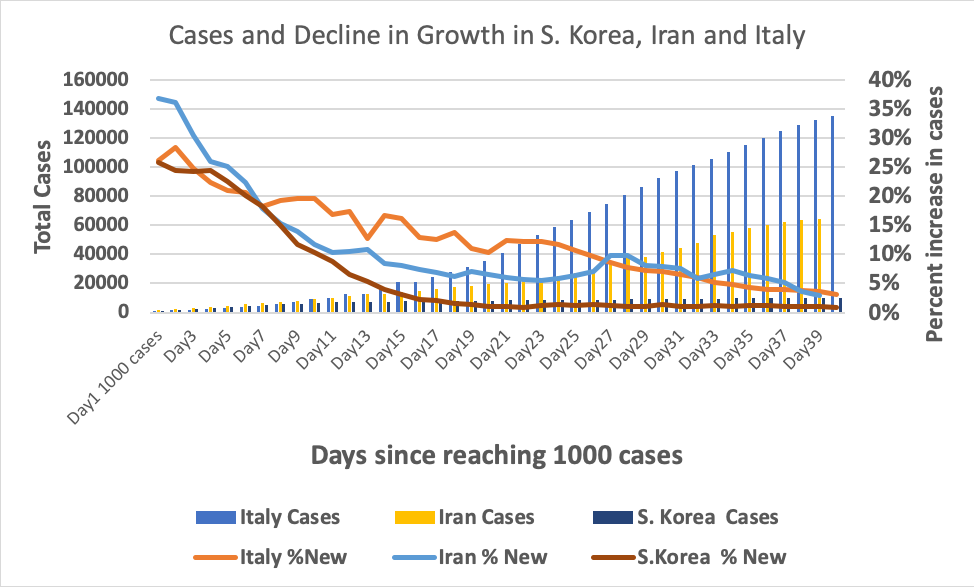
South Korea, Iran, and Italy were the next three countries to experience a dramatic increase in cases. By observing the progress from the day each country passed 1000 cases, they can be compared. In South Korea the infection was rapidly contained and kept to just over 10,000 cases. The decline in the percentage of new cases was rapid and constant in South Korea, very similar to that seen in China. On the first day that Iran had over 1000 cases, new cases were growing at 37%. That rate declined steadily to 10%, but then stayed at that level or increasing for the next 17 days, before declining again to the current rate of 3%. Italy reached 1000 cases growing at a rate of 25%, and the growth rate declined erratically until day 23. After that point the growth rate declined steadily to the current rate of 3%.
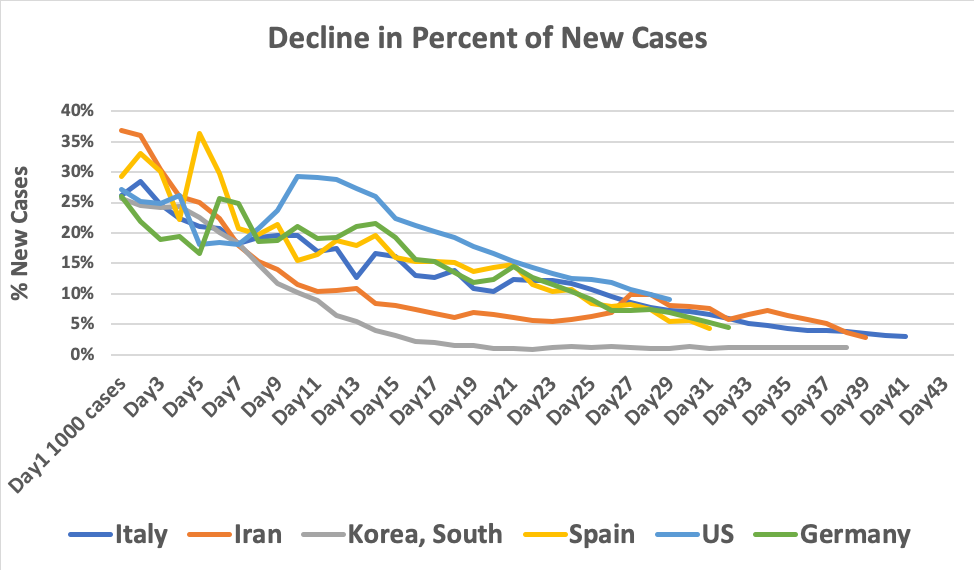
The United States, Germany, and Spain each reached over 1000 reported cases with a growth rate of 25-30% and experienced erratic fluctuations in the growth rate until day 15-21. After that, all three countries followed a pattern very similar to Italy. If these trends continue all three of these countries would reach a growth rate of 2-4% in the next 10 days.
It seems likely the combination of the lock-down, testing and quarantine of symptomatic cases, and contract tracing brought things under control in Mainland China, Hong Kong, Taiwan and South Korea. But all this has to be implemented early.
It is tempting to speculate that the voluntary and mandatory imposition of shelter-in-place, closure of most businesses and social distance measures, once enacted, lead to a regular decline in the growth rate of new cases. Of course, the accuracy of the data is limited by the extent of testing and reporting of cases.
[Note: the material presented here is from Michael’s own perspective on the public Coronavirus data and does not represent the viewpoint of his employer].
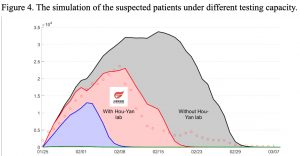 As Michael stresses the importance of testing, our publisher BGI has been heavily involved in these efforts and has witnessed first hand the power of this data to fight the COVID-19 pandemic. Distributing over 10 million PCR based diagnostic tests, after realizing one of the bottlenecks was a shortage of P2 biosafety labs they built a lab able to process 10,000 sample in Wuhan in 5 days. Named Huo-Yan or “Fire eye” after the ability of the Monkey God ability to detect hidden demons. Opening the day after Michael’s blog was posted, being able to track and trace cases in Hubei province greatly assisted the fight to get the outbreak under control. In a new preprint, BGI’s data estimates that without the establishment of the lab the suspected cases would have increased by 47%, and the corresponding cost of the quarantine would have doubled. These Huo-Yan testing labs have now rolled out across China, and are now starting to open up in the new front lines of the crisis in the Middle East, SE Asia and Europe. While wealthy countries may have the resources to build and run these labs, it’s essential to fill in the testing gaps in places that may not necessarily have testing infrastructure. To address that issue BGI has launched the “Huo-Yan Air Lab”, an easily transportable inflatable structure is intended to help ramp up virus testing and screening infrastructure. With the aim of being a BSL-2 lab that can fit in standard air freight, having airlocks, negative pressure and HEPA filtered air between the different modules (see video of it being set up by GigaScience’s Shenzhen Office).