Another Virtual Birthday: GigaScience at ISMB2021
Intelligent Systems for Molecular Biology (ISMB) conference is an annual gathering for scientists from bioinformatics, molecular biology, and data science and provides a multidisciplinary environment for disseminating recent research and development in computational biology. We are huge fans of this conference, especially as GigaScience launched at the ISMB conference in Long Beach in 2012 and the event is a highlight of our year (see the write-ups in GigaBlog). As with ISMB2020, this year’s ISMB event (July 25-30) was a Virtual Event due to the COVID-19 pandemic, and being unable to have one of our traditional birthday parties in person the GigaScience team instead put together a birthday video to celebrate 9 years of Open Science. Our Publishing Director Laurie Goodman also manning the OUP virtual booth to do a birthday cake-cutting with some friends.
GigaScience Data Scientist Chris Armit reports below on some of the major highlights of ISMB2021.
The 3D SARS-CoV-2 Viral Proteome and Augmented Reality
The BioVis COSI track meetings are intended to educate, inspire, and engage visualisation researchers in problems in biological data visualisation. There were some outstanding presentations at this event. Seán O’Donoghue (Garvan Institute of Medical Research, Sydney) gave a BioVis keynote talk entitled “Inter-disciplinary practices in BioVis” and this included exploration of the SARS-CoV-2 proteome, and the utility of extended reality in understanding protein structure. Seán showcased Aquaria, which is a molecular graphics system that generates 3D models of protein structure and additionally provides a graphical overlay of sequence features, such as posttranslational modifications. A key feature of Aquaria is that it also identifies so-called ‘dark’ regions or dark proteins with no sufficiently close relatives in existing protein databases.
With beautifully rendered 3D models, the Aquaria-COVID resource invites researchers to explore the 3D structure of the SARS-CoV-2 viral proteome. This is a fantastic and timely resource that provides 872 3D structural models – derived from all current entries in the Protein Data Bank (PDB) – that have detectable sequence similarity to any of the SARS-CoV-2 proteins. Using this systematic modelling approach, Seán and colleagues have been able to subdivide the 27 SARS-CoV-2 proteins into four distinct categories that are referred to as: teams (direct structural evidence of binding to other viral proteins); hijackers (direct structural evidence of hijacking of human proteins); mimics (direct structural evidence of mimicry of human proteins), and; suspects (believed to perform key roles in infection, but where there is currently no structural evidence of the mechanism by which this is accomplished). These categories and their wider significance in understanding the SARS-CoV-2 pathogen are outlined in an accompanying preprint that is available on bioRxiv.

Seán additionally showcased wonderful examples of 3D protein structures that are now made available with Augmented Reality (AR) and that can be interactively explored using an iPhone or Android device. There are key advantages to using extended reality in the field of structural biology. As Seán explained:
· “There’s actually an advantage in the early days of crystallography and structural biology where people were building real physical models, because the models are actually somewhat easier to understand, and this is the motivation behind trying to use augmented reality and virtual reality…to try to get back some of the advantages of physical models.”

Seán further summed up the need for interactive structural models through reference to the following quote from Molecular graphics pioneer Art Olson (Scripps):
· “Physical models can convey specializations and mechanisms in ways that images alone cannot engage. They engage perceptual cognitive processes that go beyond the visual and bring a sense of reality and natural interaction into the process of exploration and understanding.”
Spatial Transcriptomics at BioVis
There was great interest in Spatial Transcriptomics at this year’s ISMB Meeting. Also at the BioVis COSI track, Patrick Martin (University of Copenhagen) offered some fascinating insights into the challenges of image-free extraction of RNA-seq data. As an example, Patrick referred to the Slide-seqV2 spatial transcriptomics approach, which is a sequencing-based transcriptomic method that makes use of barcoded beads. Indeed, as Patrick explained:
- “Each bead has a unique barcode associated with it. After depositing these beads on a glass slide – and a preliminary round of sequencing – you now know where each of these beads are to be found on the glass slide.”
Consequently, one can think of this slide as a ‘smart slide’ that contains information about coordinate space. Following bead deposition, a researcher can take a tissue section of interest and mount this onto the glass slide containing these beads. As Patrick further explained:
- “After hybridisation between these bead barcodes, unique molecular idenitifiers, and the mRNA counts present in your tissue, you now have access to the transcriptome of this tissue in a spatially resolved manner.”
Key advantages of the Slide-seqV2 technique are that it is high coverage, high resolution with spacing between beads of about 10 micron. 10 microns is the approximate size of a eukaryotic cell, and this enables this technique to be well suited for transcriptional profiling in small numbers of cells. However, an issue with high resolution spatial transcriptomic data is that the synthetic images that are generated are highly grainy due to the beads that are used for spatial location. This is a key issue, and as Patrick explained “this is mainly due to imbalances in the number of mRNA species recovered by each barcode and this is reflected in the subsequent RGB colour code”.
We look forward to software solutions to address this issue.
ColourSpace at BioVis
Data visualisation is a major focus of BioVis, and the use of colour is one means of enabling intuitive graphical representations of high-dimensional data. On this topic, I was intrigued by the talk by Mikaela Koutrouli (University of Copenhagen) entitled “Color encoding of high-dimensional data using the CIELAB color space and state-of-the-art dimensionality reduction techniques”. CIELAB colour space is optimised for human vision as it defines colour based on three values – namely L* for perceptual lightness, and a* and b* for red, green, blue, and yellow. Correspondingly, in her talk Mikaela explored how feasible it was to map point clouds of single-cell RNA-seq data, generated using UMAP to obtain dimension reduction, into a CIELAB colour space, and whether this aided in data visualisation. A key feature of the CIELAB data representation is that a given numerical change corresponds to similar perceived change in colour, and this renders the final visualisation more intelligible. From a computational perspective, the challenge is to optimally map data points – generated using UMAP – into a polygon that represents the CIELAB colour space. As Mikaela explained:
· “We are allowed to do rotations and translations in the three dimensions, but since we want to preserve the distances – which is a feature that UMAP gave us – we can only apply uniform scaling. Our optimization algorithm is looking for the highest possible scaling factor without leaving points, outside of this polygon.”
This is a very novel approach to data visualisation with potentially wide application. As Mikaela further explained:
· “Our algorithm was fast enough, and that allows us to make it available as a web resource.”
The U-CIE web interface – which allows visualisation of single-cell, high dimensional, and distance matrix data in a CIELAB colour space – can be accessed here.
Deep Learning of Image Morphology QTLs
Artificial Intelligence is a major focus of ISMB. Barbara Engelhardt (Princeton University) – who is this years ISCB Overton Prize Winner – gave an outstanding keynote talk entitled “Cells in Space: Methods to investigate local neighborhoods of cells”. I was most intrigued by the automated analysis of GTex (Genotype-Tissue Expression) consortium data. This study aimed to capture genetic associations with image features, and as Barbara explained for GTex data – where the genotype is known – genotype plus tissue morphology can be used to define image morphology Quantitative Trait Loci (QTLs). Barbara and colleagues report on the use of an unsupervised deep learning approach that utilises a convolutional auto-encoder to extract morphological features from GTex tissue sections. As Barbara explained:
· “Manual annotation of pathology images is infeasible. Available image segmentation methods are still fairly naïve. We used an unsupervised deep learning approach to extract features.”
This approach rebuilds the image from bottlenecked features that are extracted by the auto-encoder. In an informative example, a canonical correlation analysis for images and bulk gene expression approach was used to detect both synapse decay and immune cell infiltration in human brain tissue. Consequently, this deep learning approach is suited to finding features in pathological specimens where there is abnormal parenchymal morphology and/or inflammatory infiltrate. This deep learning approach, as applied to GTex data, may prove invaluable for understanding the genotype-phenotype relationships underlying the pathogenesis of multiple disease conditions.
Machine Learning of High-Throughput Drug Screens with Sequence Data
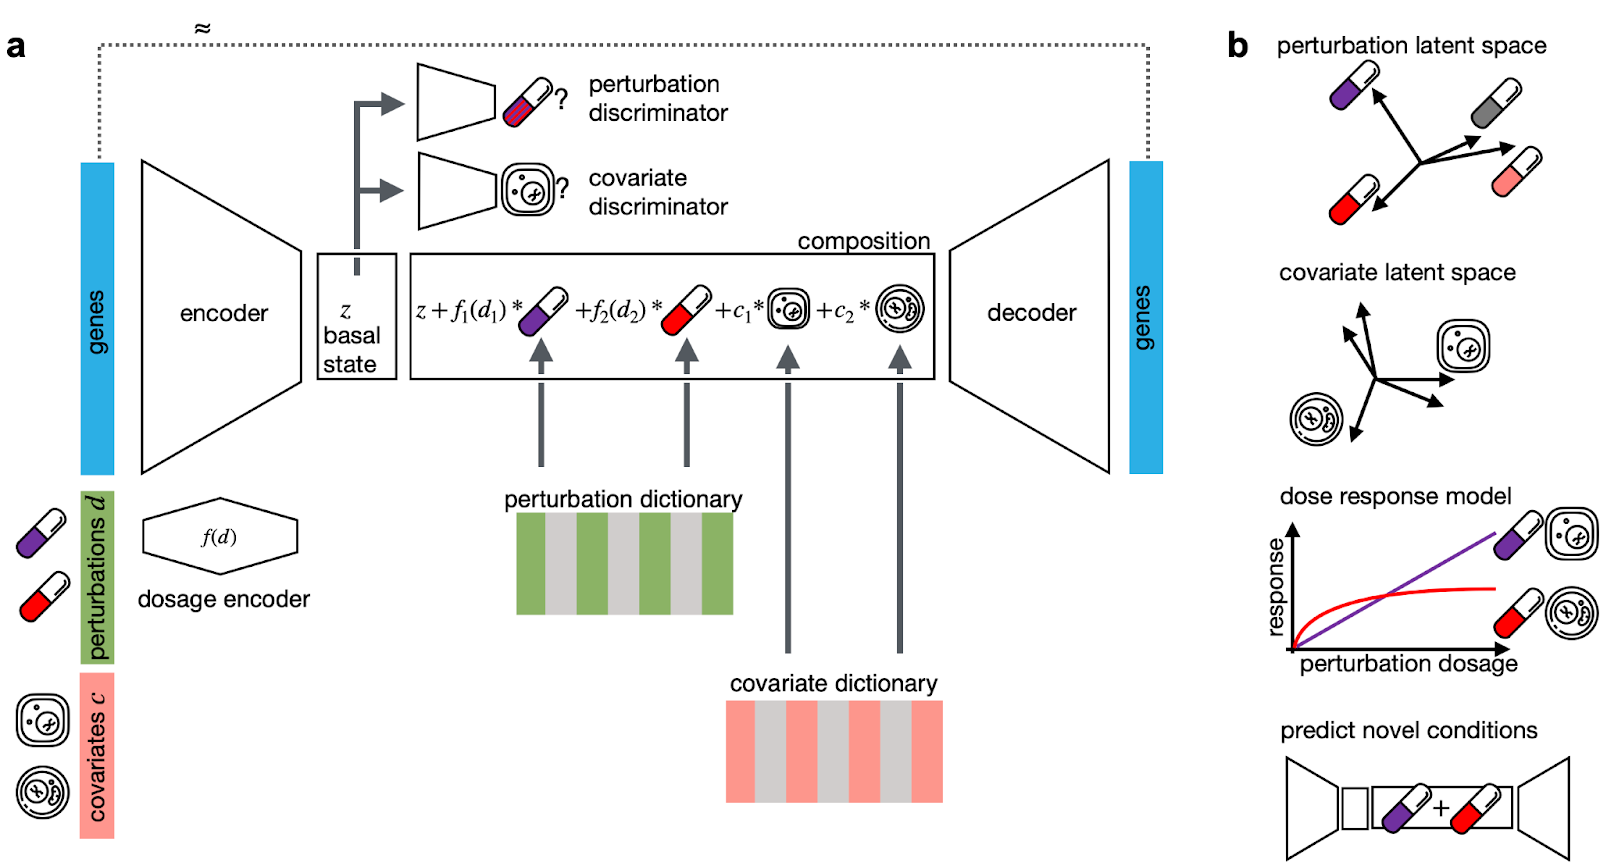
There was additional interest in self-supervised learning in the Machine Learning in Computational and Systems Biology (MLCSB) COSI track, with Mohammad Lotfollahi (Helmholtz Zentrum München) presenting on the utility of a Compositional Perturbation Autoencoder (CPA) in high-throughput drug screens. In his talk entitled, “Learning large-scale perturbation effects in single cell genomics”, Mohammad highlighted how it was possible to use CPAs to predict single cell perturbation responses across dose, time, and gene knockout combinations.
A key feature of Mohammad’s approach is the use of latent space, which is a representation of compressed data that is suited for classification using machine learning. Using a latent space representation of single cell perturbation atlas data, Mohammad showed that cell-type specific effects of candidate drugs could be accurately predicted. In addition, it was also possible to predict the effects of gene knockouts. A particularly interesting feature of this approach was that the perturbation latent space could be used to impute the response of double knockout cell lines that were not included in the study. The latter is a highly interesting feature, and highlights the utility of this method for generating what are testable hypotheses that can be followed up in secondary drug screens.
The Compositional Perturbation Autoencoder (CPA) software is available on GitHub and an accompanying preprint is available on bioRxiv.
T Cell Receptor Specificity Prediction with TITAN
Anna Weber (IBM Research, Zurich) delivered a highly informative MLCSB COSI track talk entitled “TITAN: T Cell Receptor Specificity Prediction with Bimodal Attention Networks”. T-cells are one of the main constituents of the adaptive immune system, and the panoply of specific T-cell receptors (TCR) enable recognition of foreign antigens and are major players in eliciting an appropriate immune response. As Anna explained, sequencing of TCRs and their antigenic targets (epitopes) enable associations to be made between TCR sequence and epitope binding specificity. However, there is a scarcity of epitope data with Anna highlighting that the VDJ database contains over 40,000 TCR sequences binding only 191 epitopes. To address this challenge, Anna and colleagues developed TITAN (Tcr epITope bimodal Attention Networks), which is a multimodal neural network that explicitly encodes both TCR sequences and epitopes and can be used to accurately predict binding specificity. A major feature of this approach is the use of Simplified Molecular-Input Line-Entry System (SMILES) sequences as a means of encoding epitopes in the form of a line notation of atoms. As Anna explains, this is superior to the more standard encoding of epitopes as amino acids, with SMILES encoding far more detail about the epitopes. The use of SMILES notation leads to a concomitant increase in epitope sample space, and when combined with full TCR sequences this larger sample space allows TITAN to more accurately predict epitope binding-specificity. Anna reports that TITAN exhibits significantly improved performance on unseen epitopes, and outperformed the TCR-epitope recognition prediction tool ImRex (Interaction Map Recognition). TITAN software is available on GitHub and and has recently been published in Bioinformatics.
Machine Learning to Increase Health Equality in the COVID-19 Pandemic
Emma Pierson (Stanford University) delivered a fascinating MLCSB keynote talk entitled “Using machine learning to increase health equality” and highlighted how this could be applied to healthcare in the current COVID-19 pandemic. By studying locations of anonymised cell phone mobility data from numerous cell phone apps – made available from the SafeGraph consortium – 98 million US citizens were included in this study. From network inferences an epidemiological model was developed to capture viral transmission, and this compartmental model utilises four different states, namely: susceptible, exposed, infectious, and removed (i.e. recovered or deceased). As Emma explained, the appeal of this model is that it can be used to analyse impact of social distancing, reopening strategies, and socioeconomic and racial disparities in SARS-CoV-2 transmission. As Emma explained:
· “Data science and machine learning properly applied can also reduce health inequality.”
Using this approach, Emma and colleagues were able to identify disparities in COVID-19, and in particular to identify disadvantaged groups in urban communities. Emma was quick to emphasise that “reopening plans must consider disparate impact.” Importantly, the large-scale mobility-based modelling outlined in Emma’s talk is now being translated into guidance for US and international policymakers, and an insightful preprint on this subject is available on medRxiv.
Breaking Barriers at the Bioinformatics Open Source Conference
Being Open Source and Open Science advocates we are regular attendees and supporters of the BOSC COSI: The Bioinformatics Open Source Conference, and this year we and OUP were again silver sponsors of the event. Not being there in person it was nice to see familiar faces online, such as GigaScience author Tazro Ohta presenting his Sapporo implementation of GA4GH Workflow Execution Service. As brilliant advocates of breaking down all the barriers in science, this year marked the first year they had a keynote covering open hardware and the contribution of the maker movement to biotechnology in Africa. Presented by Thomas Hervé Mboa Nkoudou from the Advanced School of Mass Communication at the University of Yaoundé II in Cameroon, this also broke the language barrier by being presented in French with English subtitles. You can watch the talks online via the OBF youtube channel.
Next year’s ISMB Annual Conference is scheduled for July 10-14 in Madison, Wisconsin and we have our fingers crossed we’ll be able to see you there celebrate our 10th birthday in person.