GigaScience at VIZBI 2022
The 12th international meeting on Visualizing Biological Data took place on March 16–18, 2022 (AKA VIZBI 2022). This conference is always a visual treat, and with its focus on transforming how Life Scientists view data from Molecular and Cellular Biology and Biomedical Science this year’s event was no exception. Due to the ongoing uncertainties around Omicron, this was a fully virtual meeting based at the USC’s Bridge Institute. VIZBI founders Jim Proctor (University of Dundee) and Seán O’Donoghue (CSIRO & Garvan Institute) organised an exceptional series of talks. We are huge fans of this conference and GigaScience Data Scientist Chris Armit is a regular attendee (see blogs of VIZBI 2019 and VIZBI 2021). Following his other conference write-ups in this blog he details below what were some of the major highlights.
Visualising 3D Chromatin Structure at the Ultrastructural Level
The functions of genomic DNA are determined by chromatin structures and 3D interactions, and there is a salient need to understand these 3D interactions at the ultrastructural level. In her talk on ‘3D Genomes’, Clodagh O’Shea (Salk Institute for Biological Sciences) highlighted the utility of ‘ChromEM staining’ as a method for electron microscopy (EM)-based visualisation of chromatin in the nucleus.
The ChromEM staining method uses a DRAQ5 membrane-permeable dye that binds DNA. The DRAQ5 dye then is used to target electrodense Osmium to DAB polymers that are formed adjacent to DNA-bound DRAQ5. Using this approach, Clodagh was able to show that human interphase and mitotic chromosomes are disordered chains with diameters between 5-24nm, but that a key difference between them is that they pack together at different densities. Indeed, on EM micrographs it could be seen that mitotic chromosomes are much more densely packed.
What was very interesting was to see these differences further explored in pluripotent and multipotent cell lines. A pluripotent cell line, such as an Embryonic Stem (ES) cell, can differentiate into all cell types of the body. In contrast, a multipotent cell is much more restricted in the cell types it can differentiate into, a phenomenon that stem cell biologists refer to as lineage restriction.
By comparing chromatin topographic maps in human ES cells and neural progenitor cells, Clodagh was able to show that there is an increase in chromatin volume concentration in the vicinity of the nuclear membrane, but that this phenomenon is much more enhanced in neural progenitor cells relative to ES cells.
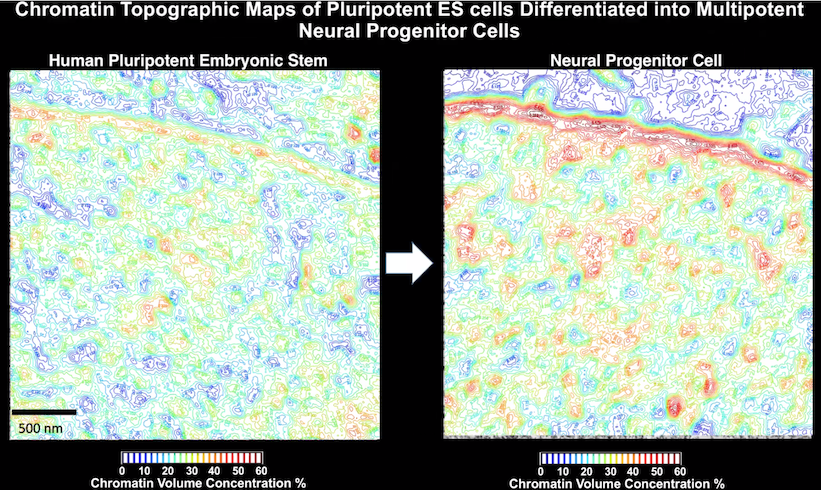
The take home message from this is that the chromatin of pluripotent human ES cells are much less tightly packed than that of multipotent neural progenitor cells, and therefore that more dense packing together of chromatin may be a feature of lineage restriction in stem cells.
Clodagh additionally introduced the ingenious technique of FIREnano (Fluorescence Iron EM Nanoparticle), which utilises self-assembling ferritin particles labelled with a fluorescent protein, and enables researchers to visualise the chromatin ultrastructure of target loci.
The fluorescent protein-labelled ferritin particles integrate into chromatin structures, and anti-GFP nanobodies can then be used to detect these structures in cells. Combining FIREnano with ChromEM is a very powerful and impressive imaging technique that can be used to explore the difference between a silent gene locus and an actively transcribing gene locus at the ultrastructural level.
For more on chromatin biology see our recent Blog on Cell Bio 2020.
Ribbon Diagrams and RNA Backbones
It was a great privilege to hear Jane Richardson (Duke University) deliver her talk. The ribbon diagrams that were created by Jane are familiar to all students of biochemistry, and indeed are now perhaps the most recognisable schematic visualisations for 3D protein structure.

Image reproduced from wikipedia, CC-BY-3.0
In her VIZBI talk, Jane focused on 3D visualisation of RNA. A major challenge in this field was elucidation of the RNA backbone structure. Jane explained that, whilst base pairing and base stacking were the major determinants of 3D RNA structure, the structure of the RNA backbone was less clear from X-ray crystallography studies.
The key to elucidating the backbone structure was using all of the backbone torsion angles. These present as seven-angle combination sugar-to-sugar units, known as “suites”. The pun here is intentional, and as Jane explains, “we call them suites (sweets) because they go from sugar-to-sugar”.
Organoids and Organogenesis
In his talk on “Organoids and organogenesis: visualising human development”, Nils Lindström (USC) used the nephron as a model to explore basic principles of development and understand how cell populations form and give rise to functional complex 3D structures. As Nils explains, “looking at this in two dimensions is highly limiting for our understanding. Careful scrutiny of human development and in vitro kidney organoid cultures in their full 3D context is important to understand how structure/function relationships emerge during development”.
Organoid cultures and whole-kidney cultures have the key advantage in that they allow you to visualise living systems. In an illustrative time-lapse videomicroscopy movie Nils showcased fluorescently labelled nephrons – the quintessential structure of the kidney – as they form from their progenitors around the tips of a growing genetically engineered mouse kidney.
So how do in vitro cultures compare to in vivo development? Nils explained that by digitally extracting nephrons from in vivo samples, his lab explored developmental progressions in both human and mouse. Strikingly, using this approach it was possible to show that gene expression profiles are highly similar in in vivo and in organoid studies. The similarities between in vivo and in vitro cultures highlight the strengths of the in vitro organoid model system for understanding human development.

And what about differences between human and mouse development? By using automated spatial mapping onto stage-matched nephron models, Nils and colleagues demonstrated that nephron development in human and mouse is a stereotypical process that is evolutionarily deeply conserved. There are of course immense differences in size between humans and mice but it is interesting to consider that we shared an ancestor that developed kidneys very much like the ones we still have today.
For more details of this study, see Keck School of Medicine of USC website.
Nils is currently exploring whether 3D organoid systems can be used to understand human disease, see https://lindstromlab.usc.edu/.
Life Unfolding inside the Cell
In his VIZBI talk on ‘Cells in living tissues’, Gokul Upadhyayula (UC Berkeley) emphasised the importance of making the invisible, visible, and as an illustrative example showcased live subcellular-resolution imaging of zebrafish embryos where even organelle dynamics could be observed.
From an imaging perspective, zebrafish have the key advantage that they are translucent, and this enables confocal microscopy and other live imaging applications to be used in the study of this model organism of vertebrate development. What I was most impressed by was the Gokul’s segmentation of individual cells in the developing zebrafish, and the ability to ‘explode’ the cells apart so that a researcher can visualise a single cell and observe the distribution and redistribution of the Golgi apparatus, mitochondria, and endoplasmic reticulum as the cells round up during mitosis.
Gokul has immense experience in merging lattice light sheet microscopy, which uses a very thin sheet of light and does not damage the cells, with adaptive optics. This technique allows a researcher to observe cellular dynamics for much longer than would be possible with alternative imaging techniques.
In an additional live imaging study, Gokul showcased immune cell migration in the zebrafish ear. These cellular resolution live imaging studies are highly informative, and provide novel and surprising views on the dynamics of life at the cellular level.
For more on imaging technology see our recent Blog on Imaging the Molecular Processes of Life.
For more on Gokul Upadhyayula, see his TED Talk.
The Nucleome Browser
In his VIZBI talk, Jian Ma (Carnegie Mellon University) presented the much-awaited Nucleome Browser, an interactive, multimodal data visualization and exploration platform funded by the NIH 4D Nucleome Program. As explained on the NIH website, “the goal of the Common Fund’s 4D Nucleome (4DN) program is to study the three-dimensional organization of the nucleus in space and time (the 4th dimension)”.
Towards this end, the Nucleome Browser web-based portal was developed in an effort to integrate genomics data, imaging data, and 3D structural models. Indeed, as Jian explains, the Nucleome Browser enables “integrative, multimodal, and interactive data navigation” and currently hosts 2,292 genomic tracks and 732 image datasets from human and mouse.
The impressive suite of web tools incorporated into this web portal enable a user to explore nucleome data from different perspectives. An important feature of this web tool is the ability to visualise genomic features on 3D chromosomal structures by using ‘drag-and-drop’ of bigWig files that are commonly used as data tracks for genome browsers. In addition, there are helpful tutorials on multi-modal integrative analysis.
The Nucleome Browser is an impressive resource, and I am particularly impressed with how easy it is to use. For more details, see the preprint on bioRxiv.
Microscopya – Explore the fantastical world inside our cells
The VIZBI Best Scientific Poster Award was selected by popular vote from VIZBI 2022 delegates, and was presented to Mol Mir, Stephanie Nowotarski, and Alejandro Sánchez Alvarado (Stowers Institute & HHMI, USA) for their poster Using illustration as a primer for interpreting cellular EM data.
In addition, the VIZBI Art & Biology Poster Award selected by VIZBI 2022 delegates was FUNGIble tokens by Leonora Martínez-Nunez (UMASS medical school, USA), which explores cell wall complexity in fungi.
Of the poster presentations, my personal favourite was the video game ‘Microscopya’ by the exceptionally talented Beata Mierzwa, who is both a molecular biologist and science artist. Microscopya is a science-themed video game taking players on a journey through the molecular world inside the cell, with hand-drawn illustrations and puzzles based on real-life scientific concepts. As the trailer for the game states ‘Explore the fantastical world inside our cells.’
For more details see BeataScienceArt.
At the close of the conference it was announced that the 13th Visualising Biological Data meeting (VIZBI 2023) is planned as a hybrid event, with the in-person event taking place from Wed 29 March to Fri 31 March, 2023, at EMBL Heidelberg. I look forward to seeing you all there.