Making sense of pangenome networks
Navigating Pangenome’s Labyrinth
In the two decades since the first genomes were sequenced, with the exponential growth of new and closely related genomes it has become increasingly difficult to visualise and compare their structure. Particularly with the large diversity and difference in genes within microbial genomes. A new computational pipeline, published in GigaScience, makes it easier to construct and visualize these pangenome networks. A “pangenome” is the entire genomic repertoire of a (phylogenetically defined) group of species. Typical pangenome tools mainly focus on analyzing gene families and analyzing core genes of a taxon, but information about physical relationships between genes are sometimes hard to extract.
With the help of the new tool, called MetaPGN, genome scientists can now explore (meta)genomes in the context of physical adjacency of genes. Using the tool makes it easy, for example, to identify structural variations in pangenome networks.
MetaPGN, which was developed by Ye Peng, Shanmei Tang, Dan Wang an colleagues at BGI Shenzhen, takes genome or metagenome assemblies as input to generate a compact graphical representation for the gene network. The network is displayed via a self-developed plugin in Cytoscape, a popular open source platform for network visualization.
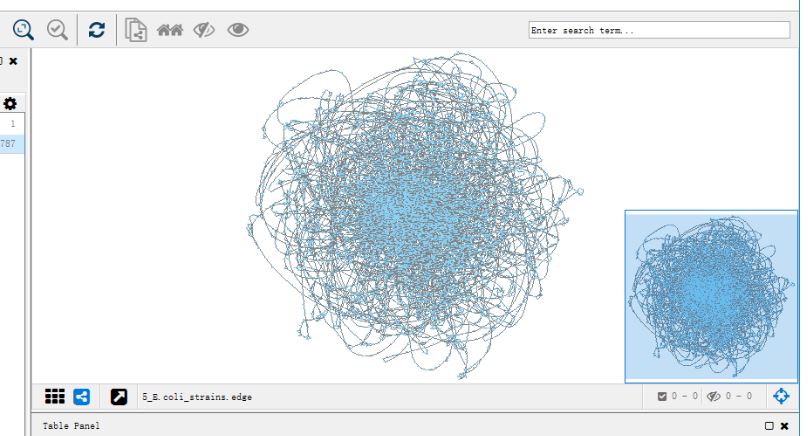
Screenshot from MetaPGN – a pangenome network before arrangement. (Source: authors’ github repository).
To demonstrate the tool’s potential, the researchers first applied MetaPGN on genomes of five pathogenic E. coli isolates and found that gene clusters encoding outer membrane proteins differ in different strains. They then scaled up to 760 metagenomic datasets and explored the E. coli pangenome network on a grand scale. In this bigger dataset, the researchers also found and visualized rather complex patterns of gene clusters encoding outer membrane proteins. MetaPGN is also useful to investigate mobile genetic elements. In the metagenome-derived pangenome network of E. coli, mobile elements are dispersed and usually strain-specific.
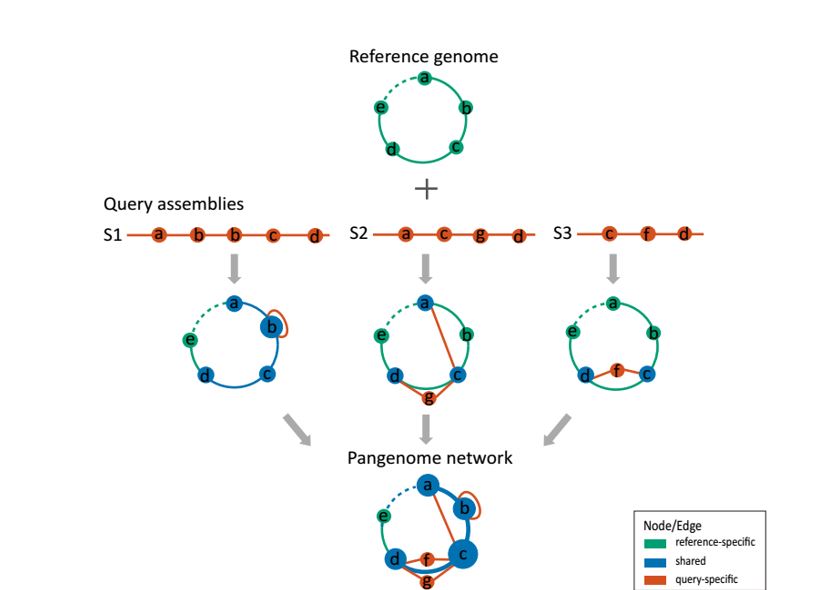
The pipeline from assemblies to a pangenome network. (source: Fig. 1, Peng et al. )
As the researchers explain, the tool is really flexible: “For example, one can also cluster genes at the amino acid level with a commonly used threshold (e.g., 70% identity) instead, to neglect slight differences among DNA sequences”. Being an open source tool input from the community is welcome, the authors say: “We are looking forward to getting help from users to improve and extend the pipeline, to contribute in facilitating pangenomic studies”.
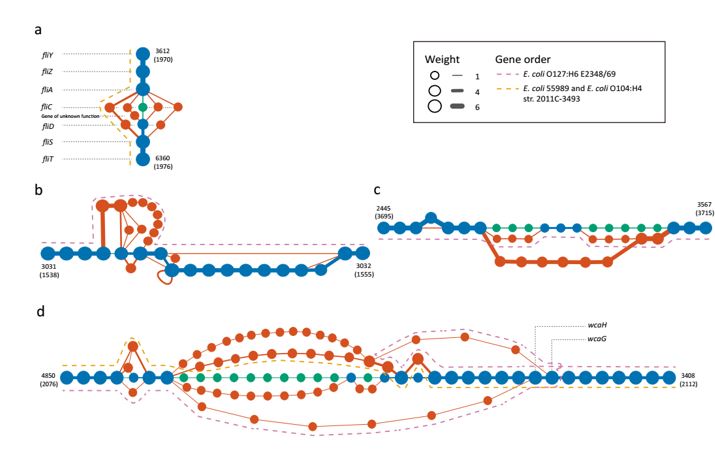
Subgraphs of highly variable genes (Fig. 2 of Peng et al).
Further Reading:
Peng Y; Tang S; Wang D; Zhong H; Jia H; Cai X; Zhang Z; Xiao M; Yang H; Wang J; Kristiansen K; Xu X; Li J (2018) MetaPGN: a pipeline for construction and graphical visualization of annotated pangenome networks. GigaScience, doi: 10.1093/gigascience/giy121.
Software available via GitHub: https://github.com/peng-ye/MetaPGN
Archival copy of the software and supporting data in GigaDB:
Peng Y; Tang S; Wang D; Zhong H; Jia H; Cai X; Zhang Z; Xiao M; Yang H; Wang J; Kristiansen K; Xu X; Li J (2018): Supporting data for “MetaPGN: a pipeline for construction and graphical visualization of annotated pangenome networks” GigaScience Database. http://dx.doi.org/10.5524/100508