From Frictionless Data to Interactive Visualisation
A guest post from our summer data science intern Raniere Silva. Raniere is a PhD Candidate at City University of Hong Kong and interested in reproducible research.

During July and August 2022, I was a summer intern at GigaScience Press investigating how GigaScience and GigaByte journals could use Frictionless Data to help researchers make data driven discovery faster. Collection of data is the most time and financially expensive part of any research and repetition should be avoided. To avoid repetition of experiments, many fields have organised infrastructure to share data, for example The European Nucleotide Archive (ENA) from the European Bioinformatics Institute and Gene Expression Omnibus (GEO) from the United State’s National Institutes of Health (NIH). Many of the infrastructure projects have developed their own data format standards and combining data can be time consuming. The Open Knowledge Foundation and Datopian have proposed a data container format, called Frictionless Data, and are overseeing the development of tools with the goal of reducing the steps needed to download and combine data. With their goal of publishing research data and software in a more reproducible manner, GigaScience Press has already carried out a number of reproducibility case studies, and experiments with platforms such as CodeOcean and Stenci.la. With that in mind they helped organise this internship to explore the utility of Frictionless Data in data publishing.

A Frictionless Data package is a JSON file enclosing a list of local or remote resources (the data) and the meta-information of the package and each resource (for example, author and licence). The start point of my investigation was how to wrap the supplement material of an article from GigaScience or GigaByte journals stored in their in-house GigaDB repository as a Frictionless Data package. I’m sure that some GigaDB users would appreciate a structured version of the list of resources in a dataset they could use to download many files using Python or R instead of clicking on the links at the dataset web page but this was a weak user case because datasets in GigaDB already have a semi-structured README file.
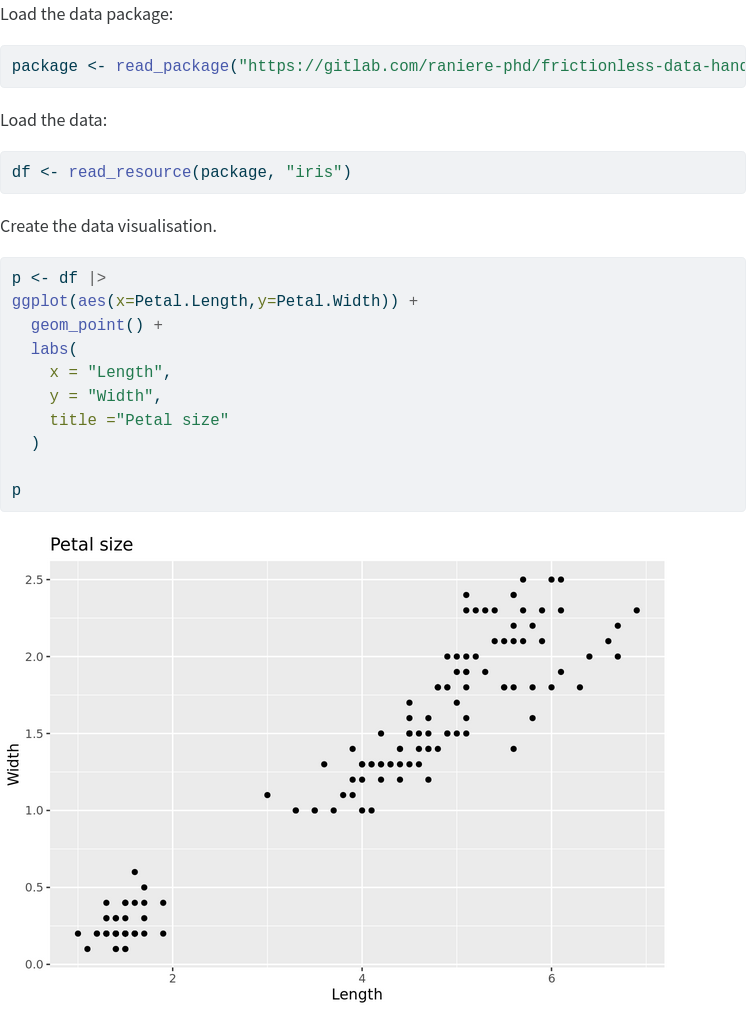
Searching for a stronger user case to adopt the Frictionless data package in GigaDB, I started to look at recreating the data visualisations in a paper from the data provided and add some interactives to the data visualisation. Because of the short duration of the internship, I limited my investigation to tabular data that GigaDB stores as CSV files. Theoretically, the Frictionless data package could store, in addition to the CSV file, the data visualisation description. For example, it could store a R snippet like:
ggplot(aes(x=Petal.Length,y=Petal.Width)) +
  geom_point() +
  labs(
    x = "Length",
    y = "Width",
    title ="Petal size"
  )
or a Vega snippet like
{
  "$schema": "https://vega.github.io/schema/vega-lite/v5.json",
  "data": {
    "url": "iris.csv"
  },
  "encoding": {
    "x": {
      "field": "Petal\\.Length",
      "type": "quantitative"
    },
    "y": {
      "field": "Petal\\.Width",
      "type": "quantitative"
    }
  },
  "height": 400,
  "mark": "circle",
  "params": [
    {
      "bind": "scales",
      "name": "grid",
      "select": "interval"
    }
  ],
  "width": 400
}
Unfortunately, the Frictionless Data ecosystem is still small and no website currently exists that will receive from the user the URL of a Frictionless data package and render a data visualisation from it. Additionally, the cross-origin resource sharing (CORS) policy imposes an extra bump in the road to produce such a website.
What I discovered during my internship is that Plotly Open Source Graphing Libraries provide wraps to convert matplotlib or ggplot2 data visualisation to HTML based Plotly data visualisation, for example:
plotly.tools.mpl_to_plotly(data_vis_with_matplotlib)and
plotly::ggplotly(data_vis_with_ggplot2)Quoting Dr Kirstie Whitaker, this was “too easy not to do”! I started a small collection of examples showing how to use Plotly’s wraps and other libraries to create a self contained HTML based data visualisation that GigaByte can embed as part of the published paper.
Back to Frictionless Data, the main output of my internship is a handbook for researchers interested to know more about Frictionless Data. The handbook covers an introduction to use Frictionless Data (see the screenshot image), an introduction to the specification, minimal working examples of creating your own data package, and long examples, based on published articles in GigaScience and GigaByte journals, illustrating the creation and use of Frictionless Data.
The goal is for the handbook to be the start of a conversation with the scientific community of how to embrace Frictionless Data. And provide a resource and guidance to make things easier for data producers to produce and submit these packages to data publishers such as GigaScience Press.
Another output of my internship was the simultaneous CODECHECKing (and issuing of a certificate) for a yet to be published paper in GigaByte. CODECHECK is a project led by Dr. Stephen Eglen and Dr. Daniel Nüst that promotes the independent execution of computations underlying scholarly research articles (see a previous post on this in GigaBlog). The CODECHECK process was a starting point for joyful philosophical and technical conversations around the CODECHECK community workflow.
You should see some examples of these frictionless data packages published in our journals soon (with some interesting additional features that have come out of this curation process), so watch this space for the end products.
Further Reading:
Frictionless Data Handbook for Researchers https://raniere-phd.gitlab.io/frictionless-data-handbook/