Guest Blog: The Ebola Epidemic revisited – where are we in 2015?
 Following from his guest blog in October on “Approaches and resources to slow the spread of infection”, Michael Dean from the Center of Cancer Research at the NIH uses his data oriented approach to give an update of where the Ebola epidemic is. While there may be less media coverage (apart from in the UK), this doesn’t relate to the situation on the ground. Michael again has pooled together various available data from the CDC and beyond to present a non-specialist view of the pandemic status, comparing his and others predictions of where we would be in 2015, if the spread of the disease is finally under control, and lessons for the future. [Note: the material presented here is from Michael Dean’s own perspective and does not represent the viewpoint of the NIH, or NCI.]
At the time of the first installment of this blog in October, the Ebola Epidemic of 2014 was headed for potential international disaster, and was correctly called “… the most severe, acute health emergency seen in modern times”. Infections appeared to be increasing logarithmically and experts at the CDC and elsewhere projected as many as 1 million cases by the years end [1]. A massive international effort was underway to employ resources to reduce transmission, improve testing and provide medical care for infected individuals [2]. A multi-disciplinary approach was clearly needed to improve the situation move towards a total eradication.
Figure 1. Map of Ebola cases in Western Africa. From WHO Situation Report, Dec. 24, 2014.
Remarkable progress has been achieved, and the WHO targets of 100% safe burial, 100% of patients in treatment facilities, universal access to 24 hour viral testing and 100% daily tracing of all registered contacts by the end of 2014 had largely been met. There are over 220 safe burial teams, 80% of the projected need, and sufficient to bury all documented cases in the three most effected countries (Liberia, Sierra Leone and Guinea).
An effort to construct Ebola Treatment Centers (ETCs); 20 to 200 bed facilities and Community Care Centers (CCCs, 8 to 30 beds) has enabled isolation and treatment to be carried out in both intense transmission areas as well as newly arising rural hot zones. There are now between 2 and 9 beds/documented or suspected case in Western Africa. In addition, all districts in the three countries have access to Ebola testing within 24 hours to allow rapid release of suspected cases that are indeed negative. The critical goal of daily monitoring of every registered contact is now 96-99% achieved.
Lastly, extensive educational efforts have reached religious and community leaders in nearly every district to aid in education of the population, early detection of newly suspected cases, coordination of burial practices consistent with local beliefs and cooperation in the placement and use of CCCs and ETCs.
The result of all these efforts have achieved a reduction in the Replication Rate (R0) to near 1 [3]. Surprisingly this reduction in R0 was achieved in September and has remained at this level, and declining below 1 in Liberia. The factors leading to the reduction in transmission are not clear, but it may be that the viral load of Ebola is very high in the late stages of disease, and so safe burial, and rapid isolation of cases are particularly important.
Liberia
The most dramatic progress has been achieved in Liberia, the site of the highest number of cases (almost 50% of all cases) and an estimated doubling rate of 24 days at the end of August. Liberia now has reduced to 60-80 new cases per week and an estimated doubling time of 180-240 days. Newly reported cases have been steadily declining since mid-November in the country as well as in the Montserrado district, the most affected area.
Sierra Leone and Guinea
The numbers of new cases and the resulting estimated doubling rates show the epidemic continues to be intense in these two countries that now drive the overall epidemic. Guinea had 120-180 new cases in each of the last three weeks of December and Sierra Leone has reported 450-650 cases/week for each of the last four weeks. Both countries have multiple districts with intense transmission including new areas emerging in the last month.
Modelling cases and mortalities
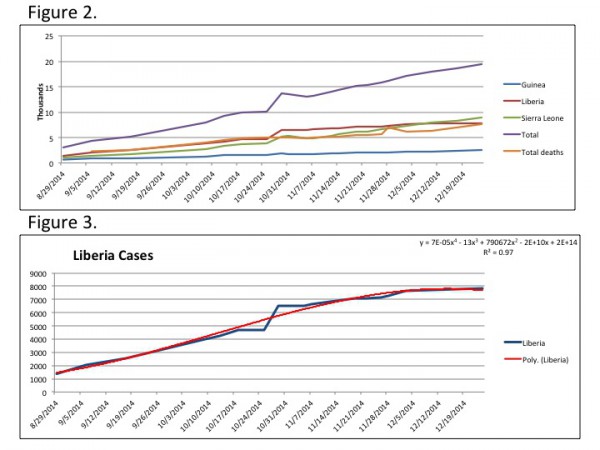
By modeling the data from 8/29/2014 to date the cumulative cases in Liberia best fits a 2-factor polynomial function and would predict that the epidemic will continue to level off and be contained. However as this epidemic has demonstrated in the past, until there are no new cases in a country for at least 21 days, victory cannot be claimed. And the extensive presence of intense transmission areas bordering Liberia continues to pose a threat.
Figure 2. Cumulative Ebola cases and deaths. Figure 3. Cumulative Ebola cases in Liberia fit to a 2 factor polynomial function with a R^2 =0.97.
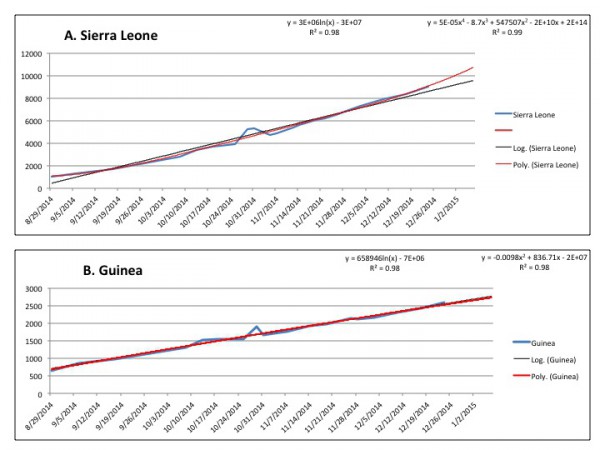
Sierra Leone and Guinea appear to still be in linear phases of transmission. It is expected that the same practices that have reduced transmission in Liberia will show results in these two counties in the near future.
0.98.” border=”0″ height=”450″ width=”601″>
Figure 4. Cumulative Ebola cases in Sierra Leone and Guinea fit to log and 2 factor polynomial functions with a R^2 >0.98.
Lessons going forward.
The last two months have seen dramatic gains in the establishment of concrete goals, mobilization of resources, and implementation to contain the Ebola epidemic. Particularly impressive has been the coordination of national, international and non-governmental bodies. While Doctors Without Borders/Médecins Sans Frontières (MSF) and Samaritan’s Purse were leading charities providing care,The International Federation of Red Cross and Red Crescent Societies (IFRC) have been leaders in implementing safe burials, Global Communities (Liberia) and Concern Worldwide (Liberia and Sierra Leone), and World Vision (Sierra Leone) have made major contributions and UNICEF has led much of the education efforts. The coordination by WHO of the efforts of the CDC, USIAD, British, Cuban and French efforts as well as the collection and distribution of funds and supplies from international and private donors is commendable. It is hoped that this epidemic will lead to lasting, improved international surveillance and early treatment of future epidemics of all kinds. It is also clear that the coordinated application of medicine, public health, epidemiology, virology, biotechnology, sociology and anthropology has been essential to rapidly understand and begin to address the many complex facets of this epidemic.
For animations and interactive maps see the NEJM and WHO interactive map. Up to date numbers and visualisations can also be found on Healthmap.org and VDU.
References
1. Meltzer MI, Atkins CY, Santibanez S, Knust B, Petersen BW, Ervin ED et al. Estimating the future number of cases in the ebola epidemic — liberia and sierra leone, 2014-2015. Morbidity and mortality weekly report Surveillance summaries. 2014;63:1-14.
2. Team WHOER. Ebola virus disease in West Africa–the first 9 months of the epidemic and forward projections. The New England journal of medicine. 2014;371(16):1481-95.doi:10.1056/NEJMoa1411100.
3. Team WHOER. West African Ebola Epidemic after One Year – Slowing but Not Yet under Control. The New England journal of medicine. 2014. doi:10.1056/NEJMc1414992.


